icenReg (available on CRAN): Package of reliable fitting of regression models for interval censored data
A package for fitting regression models (currently supports proportional hazards and proportional odds) for interval censored data. This includes semi-parametric and fully parametric models. Includes visual diagnostic tools for model fits and easy to use function for extracting predictions from the models. Includes tools for multiple imputations of censored values.
I find myself very interested in making a fully functional R-package for interval censored data that can be easily and reliably used by applied statisticians with icenReg. As such, I definitely appreciate any feedback about this package: bug reports, desired functionality or even just general feedback is appreciated!
The other software packages I've written are for more theoretical statistics, and as such, at this moment I would be a little doubtful that anyone would use them as their go-to analysis method (but maybe at some point down the line...). Because of this, I'm a little less concerned about the "feel" of those packages: my view is that you should be able to quickly and effortlessly fit and view the estimators of interest (so that a reviewer can verify the methods work and that the algorithms are robust), but it's not intended for further use, i.e. as a part of an analysis pipeline. But don't hesitate to point out any issues you may come across!
Inverse Convex Estimator Code (not on CRAN: click link below to download)
R source code for the inverse convex estimator. The inverse convex estimator fits a non-parametric estimator which constrains the density function to be of the form f(x) = 1/g(x), where g(x) is an convex function. Much like the (more well known) log-concave constraint, this insures a unimodal distribution, provides density estimates without specifying a parametric family or smoothing parameters and insures a once differentiable estimated survival curve. This constraint is also more flexible than log-concave: all log-concave distributions are also inverse convex, but inverse convex distributions allow for heavier tails, such as t-distributions. See Papers and Presentations for more details.
Main functions of interest:
inverse.convex(x): computes the inverse convex estimator for data set 'x' (a vector of values)
dIC(x, ic.fit): computes estimated density at value 'x' from estimator ic.fit (object returned by inverse.convex function)
qIC(p, ic.fit): computes estimated quantile
pIC(q, ic.fit): computes estimated cdf
Requires libraries "quadprog" and "Rcpp". Installed library from tarball will be called "InvCon".
logconPH: Log Concave NPMLE for Interval Censored Data (available on CRAN)
By constraining the estimated distribution to be log-concave, we improve the rate of convergence of the estimator (for n^-1/3 to an empirical n^-2/5 or better) due to smoothing of the estimated survival function. This can be seen as a compromise between using a parametric model (not popular because checking model fit is very difficult for interval censored data) and the unconstrained non-parametric MLE (NPMLE) which is more popular but very inefficient.
Latest release also allows for computation of a Cox-PH model with a log concave constrained baseline distribution. However, in practice the Cox-PH model can only be applied to Case I interval censored data (i.e. current status data), as the estimator will be degenerate under common scenarios for Case II interval censored data.
Main functions of interest:
logconcave(times, covariates, aug): computes Log Concave NPMLE. 'data' can either be a nx2 data frame (column 1 is left side of censored interval, col 2 is right side of censored interval), or a vector of uncensored values. Covariates are optional arguments to be supplied, which will result in a Cox-PH model with shape constrained baseline distribution
dLC(x, lc.fit, covars): computes estimated density at 'x' for 'lc.fit' estimator (object returned by logconcave)
pLC(q, lc.fit, covars): computes estimated cdf
qLC(p, lc.fit, covars): computes estimated quantile
plot(lc.fit, funtype = 'surv', ...): plots the estimated survival function. Other options for funtype = 'pdf' and 'cdf'
lines(lc.fit, funtype = 'surv', ...): draws the fit on an existing graph
NIMBLE (available at r-nimble.org)
While at Berkeley, under Professor de Valpine, I helped work on nimble, an R-package for building and analyzing DAGs (i.e. winBUGS like models). This was a very interesting project that can be viewed in many different ways; the easiest way to use it is as BUGS-like tool where you can choice your MCMC sampler instead of just using a black box. However, on a deeper level, it actually allows the programmer to use these model objects and actually write their own code for analyzing their model: at it's core, nimble is actually an R-to-C++ compiler!
At this time, I'm no longer involved with nimble, but it's a very cool project and I encourage you to poke your head in if any of that sounded interesting.
Please contact me if you have any questions or complaints about these packages
pistacliffcho *at* google's email service
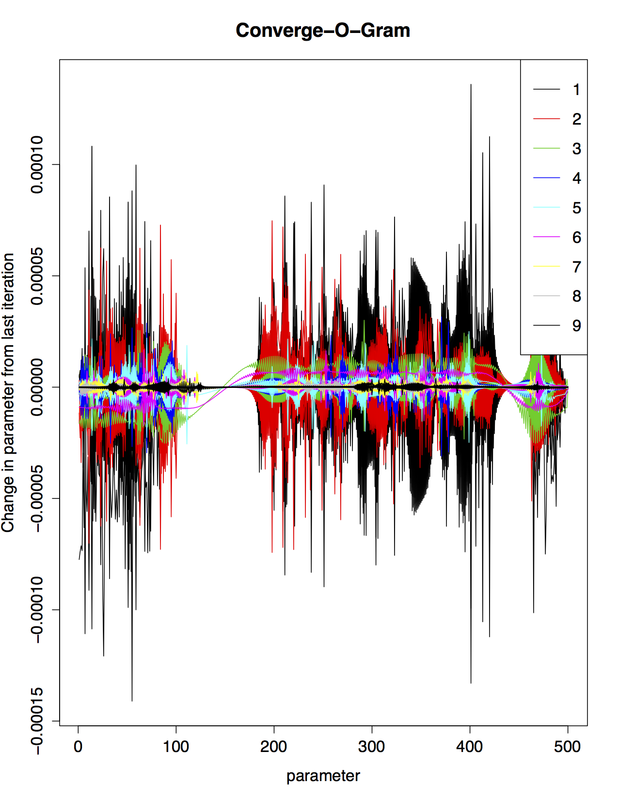
Below is a graph that I found mildly useful at one point while doing algorithm development. It tracks the changes in an ordered set of parameters at each step of the algorithm (each iteration is denoted by a different color). The "Converge-O-Gram" has the nocuous feature that the slower the algorithm preforms, the more beautiful the plot is created.